


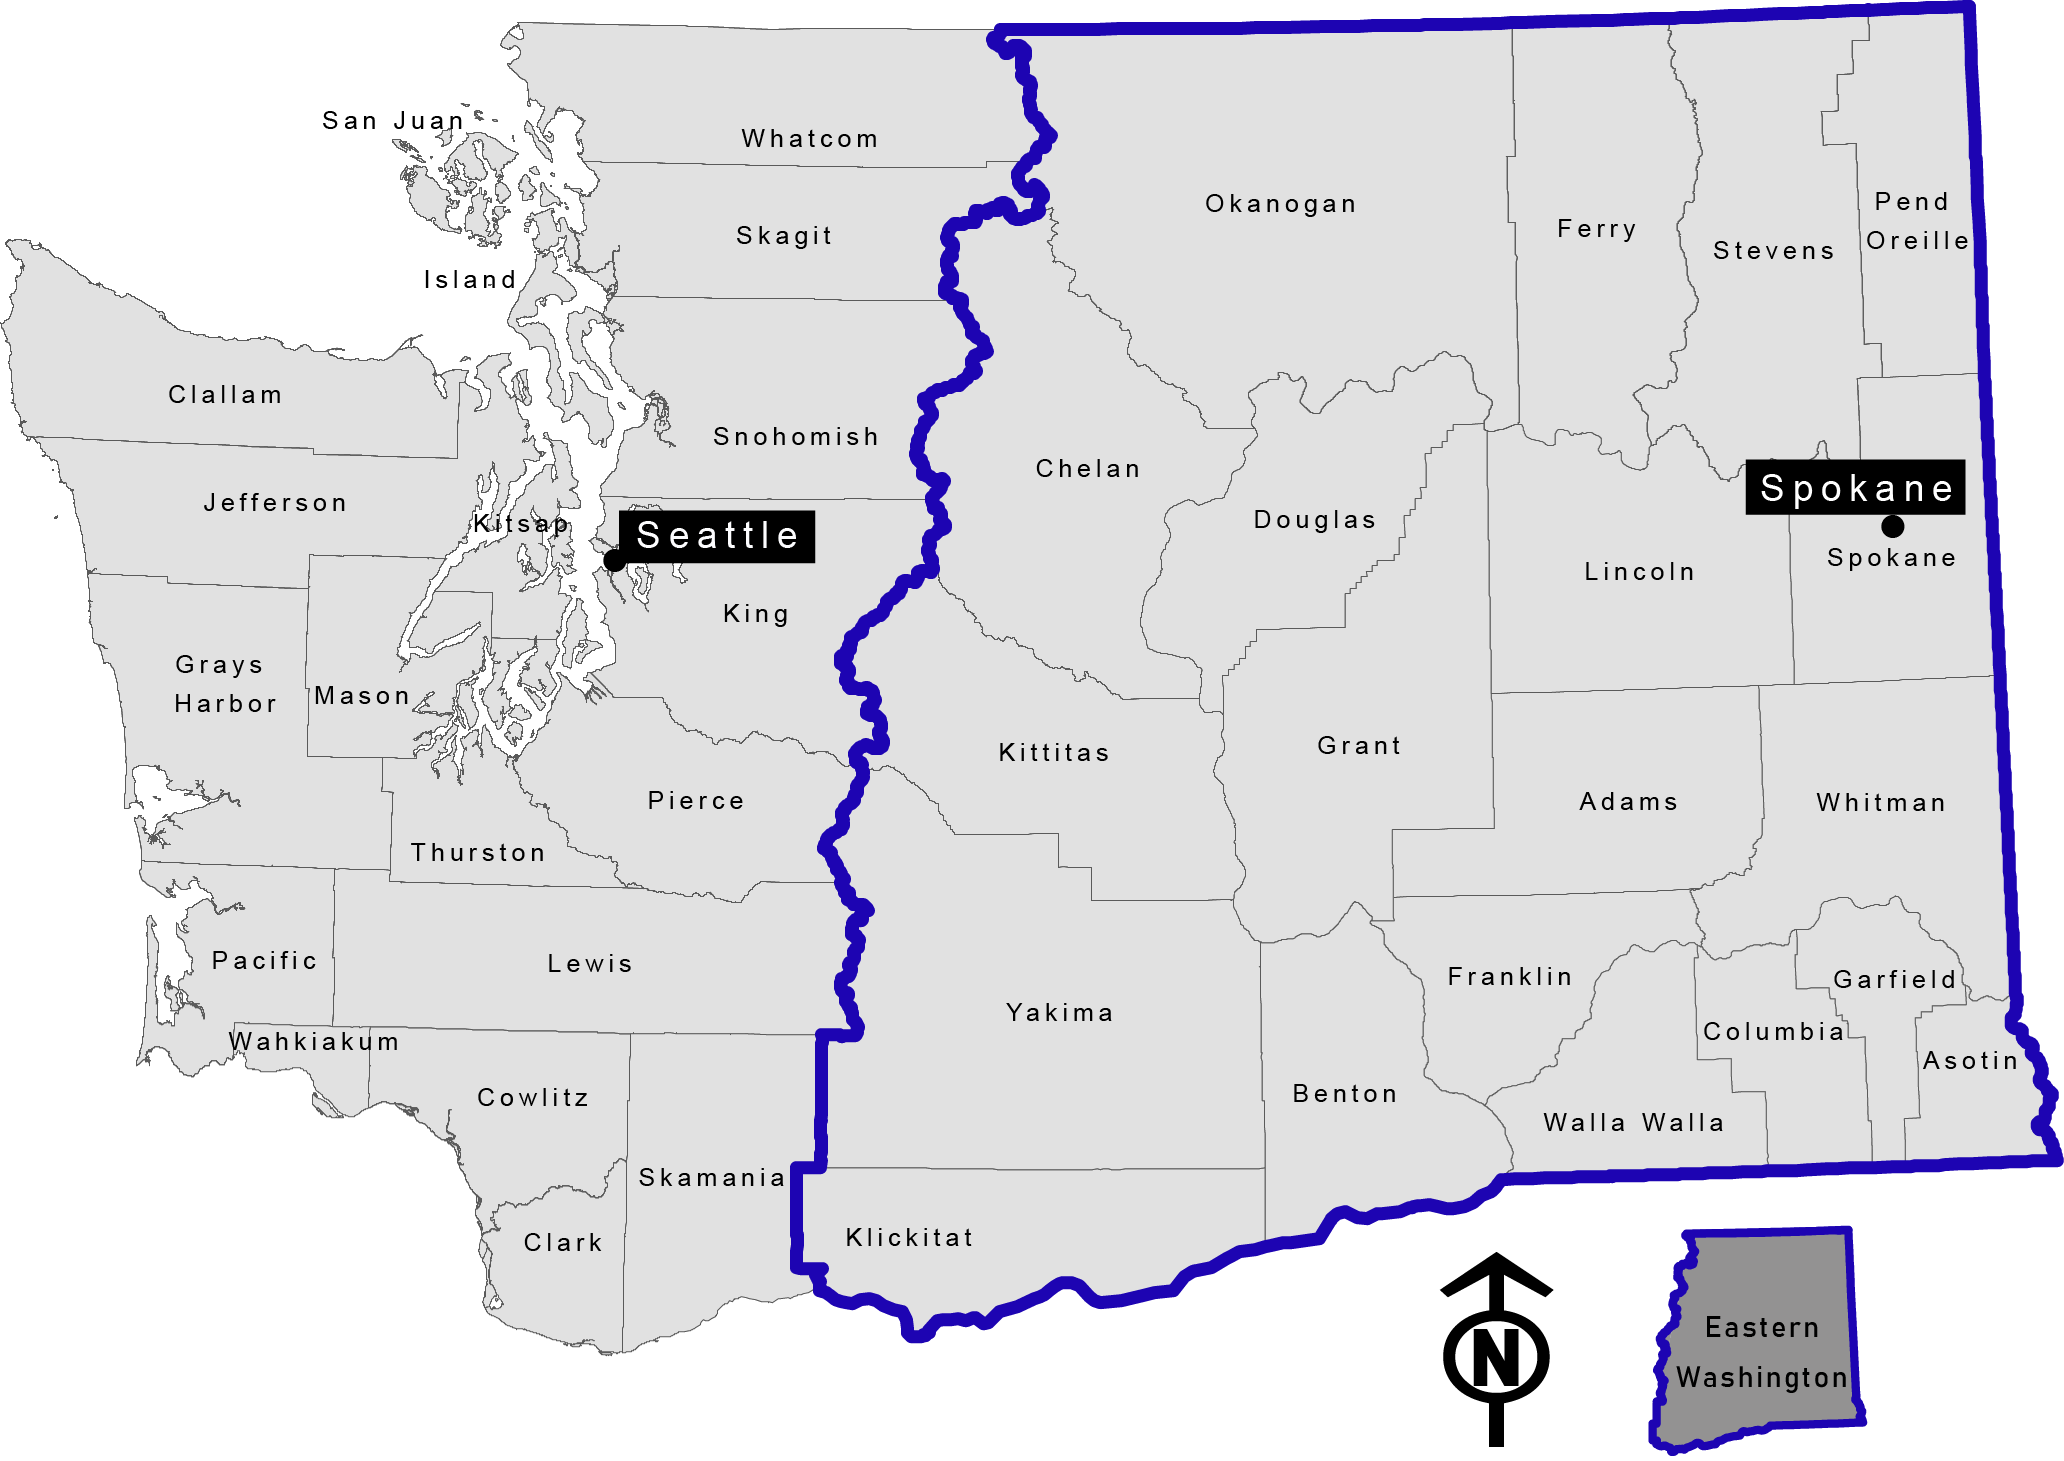
Eastern Washington at a Glance
The total population of Eastern Washington and Washington State were, respectively, 1,538,239 and 6,985,464 in 2015 (U.S. Bureau of the Census).
AGE
In 2017, approximately one-third (28%) of residents were under the age of 20. More than half (57%) were between 20 and 64 years of age, and 15% were 65 or older.
RACE
The majority of residents was Non-Hispanic White. The second largest ethnic group was Hispanics, comprising approximately 22% of the population. Eight percent of the population was of other races.
EDUCATION
Approximately 60% of residents, ages 25 and over, attained education beyond high school, with 34% earning a college degree. Twenty-seven percent (27%) of residents reported a high school diploma (or the equivalent) as their highest level of educational attainment. Fewer than 15% of residents reported they had not graduated from high school.
EMPLOYMENT
A large proportion (56%) of residents, ages 16 and over, were employed. Thirty-nine percent (39%) were not in the labor force. Five percent (5%) were unemployed.
POVERTY
Nearly 18% of the population lived below the poverty level. Forty percent of residents (40%) had incomes less than twice the poverty level.
STABILITY
Sixty-four percent (64%) of households owned their property. Approximately 84% of owner-households moved into their property in 2010 or earlier, while 36% of renter-households lived at the same property since 2010 or earlier.
RURAL POPULATION
According to rural urban commuting area (RUCA) codes, 71% of residents lived in metropolitan areas. Fourteen percent of residents (14%) lived in micropolitan or large towns. Individuals living in small towns and rural areas constituted 15% of the population.
PATHS TO DISPARITY
| Rural Urban (RUCA) | Socioeconomic Status(Singh Index) | |||||||
|---|---|---|---|---|---|---|---|---|
| U.S. Rate - Rank | Cause of death | ICD–10 | Rural Rate | p-value | Significant | More Deprived | p-value | Significant |
| All Causes of Deaths | ALL | Lower | 0.052 | No | Higher | <0.001 | Yes | |
| 2 | Cancer | C00–C97 | Lower | 0.01 | Yes | Higher | <0.001 | Yes |
| 1 | Heart Disease | I00–I09,I11,I13,I20–I51 | Lower | 0.783 | No | Higher | <0.001 | Yes |
| 6 | Alzheimer’s disease | G30 | Lower | <0.001 | Yes | Lower | 0.645 | No |
| 4 | Unintentional Injuries | V01–X59,Y85–Y86 | Higher | 0.022 | Yes | Higher | <0.001 | Yes |
| 3 | Chronic Lower Respiratory Diseases | J40–J47 | Higher | 0.407 | No | Higher | <0.001 | Yes |
| 5 | Cerebrovascular diseases(Stroke) | I60–I69 | Higher | 0.918 | No | Higher | <0.001 | Yes |
| 7 | Diabetes | E10–E14 | Lower | 0.249 | No | Higher | <0.001 | Yes |
| 8 | Suicide | U03,X60–X84,Y87.0 | Higher | 0.005 | Yes | Higher | <0.001 | Yes |
| 9 | Chronic liver disease and cirrhosis | K70,K73–K74 | Lower | 0.732 | No | Higher | <0.001 | Yes |
| 10 | Flu - Pneumonia | J09–J18 | Lower | 0.865 | No | Higher | <0.001 | Yes |
| - | Overdose | X40–X44, X60–X64, X85, Y10–Y14 | Lower | 0.009 | Yes | Higher | <0.001 | Yes |
*RUCA = RUCA (rural-urban commuting area) codes use United States census tracts to classify and rural urban differences using measures of population density, urbanization, and daily commuting. RUCA primary codes of 1-3 was classified as metropolitan areas, and RUCA primary codes of 4-10 (micropolitan, small town, and rural areas) was classified as Rural areas.
*Singh Index= Area Deprivation Index (ADI) developed by Dr. Gopal Singh, representing socioeconomic status using 17 different census markers at the level of census tract. ADI was dichotomized into least-deprived to most-deprived areas based on median ADI value.
*Statistical analysis - Independent samples t-test
*P-Value significant at <0.05
SUMMARY
For the top 10 major causes of death, mortality rates in Eastern Washington are consistently higher when compared to Western Washington.
Age-adjusted mortality rates (per 100,000), both sexes, 2011-2015
| Disease | Eastern WA | Western WA | WA | United States |
|---|---|---|---|---|
| All-causes | 716.17 | 659.79 | 672.17 | 733.1 |
| Cancer | 158.98* | 155.96 | 156.58 | 158.50 |
| Heart Disease | 146.93 | 134.50 | 137.23 | 168.50 |
| Alzheimer’s disease | 44.76* | 43.45* | 43.75 | 29.40 |
| Unintentional Injuries | 45.18* | 35.58 | 37.71 | 43.20 |
| Chronic Lower Respiratory Diseases | 46.65* | 37.85 | 39.82 | 41.6o |
| Cerebrovascular diseases(Stroke) | 37.57 | 33.40 | 34.36 | 37.60 |
| Diabetes | 24.53* | 20.78 | 21.61 | 21.30 |
| Suicide | 15.27* | 13.98* | 14.24 | 13.30 |
| Chronic liver disease and cirrhosis | 13.44* | 10.37 | 11.02 | 10.80 |
| Flu - Pneumonia | 10.97 | 9.60 | 9.91 | 17.80 |
| Overdose | 12.40 | 13.35 | 13.14 | 16.30 |
*Represents rates higher than the national average
CONCLUSION
Eastern Washington had higher age-adjusted mortality rates for the 10 leading causes of deaths than western Washington. Age-adjusted mortality rates for 6 out of the 10 leading causes of death (i.e., Alzheimer’s disease, unintentional injuries, chronic lower respiratory diseases, diabetes, suicide, and chronic liver disease and cirrhosis) were higher in eastern Washington when compared to the United States average rates. Considering that some deaths such as unintentional injuries, chronic lower respiratory diseases, and diabetes can be potentially prevented, efforts should address demographic, socio-economic, and environmental factors that influence mortality rates.
In eastern Washington, nearly 18% of the population lived below the poverty level, while 12% lived below the poverty level in western Washingtonians. Additionally, individuals living in small towns and rural areas constituted 15% of the population in eastern Washington, while only 2% of the population of western Washington lived in small towns and rural areas. Future studies can assess how poverty, rurality, and access to care impact higher rates of mortality in eastern Washington.
In eastern Washington, nearly 18% of the population lived below the poverty level, while 12% lived below the poverty level in western Washingtonians. Additionally, individuals living in small towns and rural areas constituted 15% of the population in eastern Washington, while only 2% of the population of western Washington lived in small towns and rural areas. Future studies can assess how poverty, rurality, and access to care impact higher rates of mortality in eastern Washington.
METHODOLOGY
- Age-adjusted adjusted mortality rates were computed using the standard population age distribution of the population of the United States for the year 2000
- Registered deaths for the state were obtained from the Washington State Department of Health, Center for Health Statistics for the years 2011-2015
- Deaths with residential address matching accuracy of 80% or above were included in the analyses
Do you have questions about the report or would you like to have access to the data? email us at: ofer.amram@wsu.edu